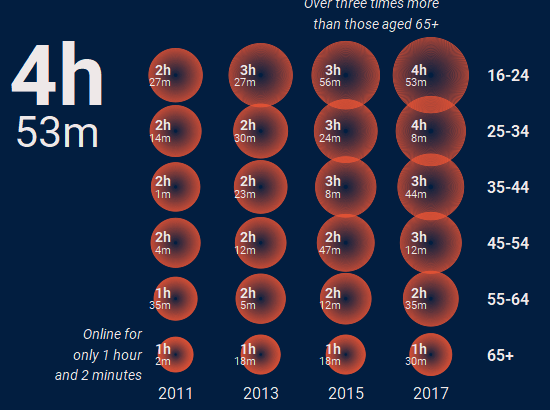
This is the online age gap
We're all spending more time online. This small visualisation shows how pronounced the gap between younger and older people is. While this won't come as a big surprise, it goes some way to explaining my previous post on the gap in TV-viewing behaviour. The data used for this visualisation is from the OFCOM Communication Markets …