
The BBC Tableau Style Guide covers a lot of detail on best practice approaches that help the BBC’s Audiences team create consistent and impactful dashboards.
But getting Tableau developers to implement these practices and reformat workbooks each time they’re developing a new dashboard is a big ask. Which is why we invested a fair chunk of time on developing a template that helps them be style guide compliant from the begging.
Here, I’ll be looking at the techniques we’ve used to hack a template together.
It’s worth saying that this approach is heavily indebted to Matt Francis’s take on a default template – you can read that approach here.
Build fully-formatted charts and dashboard layouts
This is the fun part. Essentially you want to develop a set of dashboards and charts that are commonly used. In the BBC Style Guide template we designed five standard graph types and three main dashboard layouts. this is a bit of a balancing act to cover as many uses cases as possible without going overboard.
So, let’s get started. I’m going to set up a new template using the Sample – EU Superstore data.
Do basic workbook formatting
Set some basic custom workbook formatting (Format -> Workbook… from the top menu). I’m going to go with a Gill Sans font throughout, set at full black and change most of the line settings to something a bit more subtle.

Do some basic worksheet formatting

You can also add some basic sheet formatting to get started. You don’t have to drop any values into view to do this.
For example, I tend not to use row dividers unless I really need them, so this is where I’d switch them off.
This already gives me worksheet that looks a bit different from the Tableau default. Which is exactly what we want.
Start with some basic graph types
Let’s get a bar chart in there. Duplicate Sheet 1 and call it Bar. Bring in some data to create a bar chart. You should notice it already looks pretty different to the Tableau defaults.

Now there are already some things I’d change with this for a bar chart. There’s a lot of infrastructure here that doesn’t need to be on the graph. So I’m going to pre-format it to the custom style I want.
I’m going to remove the grids and add labels to the bars, remove thee colour outline, and make sure that the text alignment on rows is right-aligned. The Field Labels for Rows also goes.

Also, make sure you change the mark from Automatic to Bar – this ensures that this particular view conforms to a bar chart setup.
Sadly, removing the title from the axis or hiding the axis won’t stay with the template, so not much point in tweaking that. But on the whole, this should give you a pretty strong starting point for any new bar chart.
There are a couple of other things to apply here. I’m a tooltips-should-be-opt-in kind of guy, so I’m going to switch them off. I’m also going to switch off the command buttons (genuinely have never ever needed them in a viz).
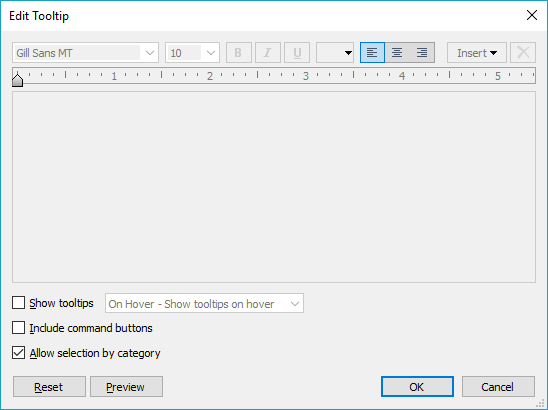
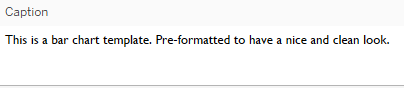
The other little trick here is that you can use the worksheet caption to tell your users how to use this chart template. Super-useful if you’re rolling this out to a bunch of other users.
Repeat, repeat, repeat

Do the same for other chart types. In this example, I’m keeping it basic, so I’m adding a KPI, a time series and a scatterplot as the graphs I expect to use the most often.
Of course, you can add more or fewer graphs to this. But I would recommend keeping your original Sheet 1 and renaming it as Generic (or similar), so you can use it to build other chart types.

For the BBC Tableau Style Guide template we built a few different Generic chart types to make sure users can keep their visualisations varied.

That’s it for graphs. Now to tackle dashboard layouts.
Build some pre-formatted dashboard layouts
Having standardised chart types is all fine and well. But you will also want to bring in layouts, branding and other elements into view.
This is still super-simple, just keep building things out, as if you were building a dashboard. Ideally you want to get all your chart types in there – this means that later, your users can test how their data looks in different layouts.
I’m using a wide layout as an example, but you can create as many dashboard layouts as you think necessary. You can use the worksheets to start placing different charts to get a feel for how they work together.

In this case I’ve also left space for the title, branding and a dashboard description on the left. You can also use brand images, contact icons, basically anything that you use over and over in a dashboard.
The hacky bit happens next.
Remove your data source
Basically, after all that hard work formatting and tweaking your visualisation, you start breaking it. This is where I recommend you do a quick Save as…
The steps are pretty straightforward.
Go through each graph template you’ve set up and remove the pills that are in view. It’s important to do this first, otherwise, when you delete the data source all the charts disappear with it.
Once you’ve removed all the pills from the graphs, pick any worksheet, right-click on your data source and select Close. This removes the specific data, meaning you can use the template with any new data source.

Once you’re done, save the file. I also highly recommend using the final trick Matt describes here – having the file as a read-only means you don’t have to worry about breaking it. Once done, it’s also worth pinning the file on your Tableau Start Page.
There’s another neat technique you add to the mix here. You can Bookmark (Window -> Bookmark -> Create bookmark… from the top menu) the individual chart types you’ve created so you can bring them in from whichever workbook you’re in. Better yet, these are shareable, as long as your users save them in their Tableau Repository under Bookmarks. Admittedly, Bookmarks are tucked away as a feature in Tableau, so if you go down this route, you will need to make a song and dance about it.
So, until we get built-in templates…
Obviously, this is a hack. Hopefully the team at Tableau are looking into fully-fledged templating functionality. The recently released Dashboard Starters is certainly a nod in the right direction.
But until then, this approach might help your team spend a bit more time on analysis and a bit less time on formatting.
You can find final version of the template over on Tableau Public.